Friday, November 15, 2013

Use application lock to synchronize T-SQL code

Application lock can be used to synchronize T-SQL code, you can control if the session is able to run the t-sql code at same time, it is like the lock keyword in C#.

1. Get lock
you can get application lock with store procedure sp_getapplock, which must be run from within a transaction.

BEGIN TRANSACTION
DECLARE @res INT
EXEC @res = sp_getapplock @Resource = 'mylock', @LockMode = 'shared';
select @res

2. Release lock
EXEC sp_releaseapplock @Resource = 'mylock';

Here is example
1. Start a session and run the code below
--spid 52
BEGIN TRANSACTION
DECLARE @res INT
EXEC @res = sp_getapplock @Resource = 'mylock', @LockMode = 'exclusive';
select @res

2. Open another session and run the code below
--spid 54
BEGIN TRANSACTION
DECLARE @res INT
EXEC @res = sp_getapplock @Resource = 'mylock', @LockMode = 'shared';
select @res

the session spid 54 will be blocked, you can check the blocking status with "sp_lock" or DMV "sys.dm_tran_locks".


here, spid54 is blocked by spid52 and waiting for application lock "mylock". 
if you release lock in spid 52, spid54 can get the application share lock then. by this way you can synchronize the code execution between sp_getapplock and sp_releaseapplock among multi-thread.

like all other lock, application lock will cause deadlock issue as well, please note, if the sp_getapplock is failed because of deadlock victim, the transaction will not be rollback, sp_getapplock will return -3 instead. it will cause orphan transaction sometimes, so you need to rollback the transaction explicitly. 


Saturday, November 9, 2013

log shipping restore job failed on secondary server

Several Situation will cause the log shipping restore job failed on secondary server

1. Restore job is not able to access the transaction log backup file.

    a) Other process is accessing the backup file, and lock the file, so restore job can not access it at the same time. 
        you can use "Process Explorer" to check which process locks the transaction log backup file
    b)permission issue. 
        check the secondary server,  make sure the SQL Agent service startup account has been granted correct permission.

2. Transaction log backup file is corrupted
    Then have to rebuild the log shipping.....

3. Some log backup file is missing
    All the log backup files should be consecutive. the restore job restores the log backup files based on the time stamp in backup file name. on secondary, System table msdb..log_shipping_secondary_database has a column saving the file name of last restored backup file,  any log backup file with bigger time stamp in its file name will be restored, if there is log backup file missing, the lsn chain will be broken, then the restore job will be failed. In order to find out the missing file, you can:
    a) on primary server, run the query below to list all log backup file history
select distinct s.first_lsn, s.last_lsn, s.backup_finish_date,y.physical_device_name
from msdb..backupset as s inner join
msdb..backupfile as f on f.backup_set_id = s.backup_set_id inner join
msdb..backupmediaset as m on s.media_set_id = m.media_set_id inner join
msdb..backupmediafamily as y on m.media_set_id=y.media_set_id
where (s.database_Name='xxx') order by s.backup_finish_date desc

   b) on Secondary, 
       run "Restore headeronly" to check the log backup file first_lsn and Last_lsn

   c) check the database last lsn on secondary server with "DBCC DBTABLE"
=======================
       --Get the database last lsn
declare @str char(64),
@file bigint,
@file_size int,
@array bigint,
@array_size int,
@slot int,
@command nvarchar(400),
@end_of_log_lsn     numeric(25,0),
@database_name varchar(100)
        --Set the database name here
Set @database_name='mytest'

set @command = N'dbcc dbtable(' + CONVERT (nvarchar, DB_ID(@database_name)) + N') with tableresults, no_infomsgs'

declare @temp table(parentObject nvarchar(255),Object nvarchar(255),field nvarchar(255),value nvarchar(255))
insert into @temp exec( @command )
select @str = value from @temp where field like '%m_flushLSN%';
set @file_size = charindex(N':', @str)
set @file = cast( LEFT( @str, @file_size - 1) as bigint)
set @array_size = charindex(N':', @str, @file_size + 1)
set @array = cast( substring( @str, @file_size + 1, @array_size - @file_size - 1) as bigint)
set @slot = cast( substring( @str, @array_size + 1, charindex(N' ', @str, @array_size + 1) - @array_size ) as int)
set @end_of_log_lsn = @file * 1000000000000000 + @array * 100000 + @slot
-- make sure @slot < MAX_SHORT (1024 * 64)
-- check to make sure tht file and array are < 4 Gig.

if (@end_of_log_lsn < 1000000000000000 or @slot >= 65536 or @file >= 4294967296 or @array >= 4294967296)
begin
set @end_of_log_lsn = null
end

select @end_of_log_lsn as 'Last LSN'
=======================
After you get the last lsn of the database on secondary, comparing it with the log backup file first_lsn and Last_lsn to see if it is out of the backup file lsn range. if you can not find the db last lsn fit into any log backup files, then it mean there is file missing, then use the query in step a) to search which file is missing. 

and bear in mind, the first thing is checking restore job history to get the detail error message, then use the steps upper to narrow down the issue. 


Friday, November 8, 2013

"Failover Partner" keyword in connection string - Q&A

1. How to connect client to a Database Mirroring Session with failover aware

A: add FailoverPartner keyword in the connection string, for instance:
"Server=sq01;Failover Partner=sq02; Database=mydb; Network=dbmssocn;Trusted_Connection=yes"

2. why I get timeout error more frequently when I connect to mirrored database with keywords "Failover Partner"?

A: You probably encounter a .Net bug which happens on mirrored database, please refer to the link below
the workaround would be 
•Set the time-out connection string to the 150 

3. If the "failover partner" parameter is incorrectly setup in the connection string, is the client still aware of the failover, and connect to the mirror(new primary) after failover?

A: The Answer is YES.
when client connect to the primary server first time, it will download the mirror server name, and cache it in client process as failover partner name, it means, even if you set the wrong "Failover Partner" value in the connection string, client still can connect to the correct mirror server when failover happen. for instance, 

we have database mirror setup on SQ01 and SQ02, SQ01 is primary, in your connections string, we use SQ03 as failover partner as below, actually sq03 is not existed. 

"Server=sq01;Failover Partner=sq03; Database=mydb; Network=dbmssocn;Trusted_Connection=yes"

when you failover db from sq01 to sq02, your connection will be failed, but after you reconnect it without changing any connection string,  you can still get the data which is from sq02. 

so even without specifying the failover partner name in the connection string, client can still access primary or mirror when failover, just like below
"Server=sq01;Failover Partner=; Database=mydb; Network=dbmssocn;Trusted_Connection=yes"

Now you know, the words "Failover Partner" is the key in the connection string

4. how about the "Server" keywords in the connection string? if it is wrong, can client still support failover?

A: "Server" is most important in the connection string, here has several situation. let's use the previous sample
primary is sq01, mirror is sq02, sq03 is not existed.

1. "Server=sq03;Failover Partner=sq02; Database=mydb; Network=dbmssocn;Trusted_Connection=yes" 
Failed, client can not connect to the server since 02 is mirror and not online.

2. "Server=sq03;Failover Partner=sq01; Database=mydb; Network=dbmssocn;Trusted_Connection=yes" 
successful, client connected 03 failed, then tried to connect failover partner which is sq01
but it doesn't support failover database from sq01 to sq02.  in other words, after client get data from sq01 successfully, if we failover db from sq01 to sq02, client will lost connection, and can not failover to sq02 automatically.

5. last question, just for interesting, if 2 db have same name on sq01 and sq02, both online, does it supports failover

A: No, it will not happen. let's say you have database mydb on sq01 and sq02, both are online without mirroring, you use the connection string below
"Server=sq01;Failover Partner=sq02; Database=mydb; Network=dbmssocn;Trusted_Connection=yes" 

then , if the db on sq01 is online, your client can get data from sq01, but if the db on sq01 is not accessible, you will get error below:
Exception calling "Open" with "0" argument(s): "Server sq02, database mydb is not configured for database mirroring."

so it tells us the client provider is aware of mirror :) don't want to cheat it. 

database mirror is phasing out from new sql server version, alwayson is new technology of HA now.

Wednesday, November 6, 2013

One Database Mirror disconnected case

Today I got a database mirror case, I was told the all databases were in disconnected\in recovery status on both primary and mirror server, it is a dev environment.

Here just share my troubleshooting steps:

1. First, I login primary and mirror server. I got the same database status on both 2 servers


so it showed to me:
       a) since all databases had problem, it should be a system level error, not single database issue
       b) database in "disconnected/In Recovery" status, it indicts the server not only lost communication with the partner server(primary or mirror), but also lost communication with witness. so sql server can not bring database online on either servers, or else it will cause split-brain problem.

the question now is : why the 3 servers lost communication with each other?

2. Check connection among 3 servers with telnet command
telnet [sqlservername] [port]

all 3 servers can connect each other, so the network should be fine, and endpoing port is opened, firewall should be fine.

3. Check SQL Server Errorlog
I checked the sql server errorlog on all 3 servers(primary, mirror, and witness), I found same error message below:
2013-11-06 23:07:47.70 Logon       Database Mirroring login attempt by user 'xxx\xxxxx-db.' failed with error: 'Connection handshake failed. The login 'xxx\xxxxx-db' does not have CONNECT permission on the endpoint. State 84.'.  [CLIENT: xx.xx.xx.xx]

so it should be permission account of account 'xxx\xxxxx-db'

4. Check Account 'xxx\xxxxx-db' in sql server
By checking account permission, it shows the account is sys admin on every sql servers. so there should be no permission issue.

in your case, if you find account is not sys admin, make sure you grant connect endpoint permission to that account.

so what's wrong here? 
Although the account is sys admin in sql server, but it doesn't mean the account is 100% ok, because it is window domain account, when using window authentication mode, sql server will ask window to authenticate the user account first(by NTLM or Kerberos), if windows authentication is failed, sql server will reject that login request.

so I tried to login sql server with the account 'xxx\xxxxx-db', this time I got error message below:


Good. we are closed to the answer. normally, you can find the detail information of login failed error in errorlog just like below:
2006-02-27 00:02:00.34 Logon     Error: 18456, Severity: 14, State: 8.
2006-02-27 00:02:00.34 Logon     Login failed for user '<user name>'. [CLIENT: <ip address>]

the most important information is "State" code:

ERROR STATE
ERROR DESCRIPTION
2 and 5
Invalid userid
6
Attempt to use a Windows login name with SQL Authentication
7
Login disabled and password mismatch
8
Password mismatch
9
Invalid password
11 and 12
Valid login but server access failure
13
SQL Server service paused
18
Change password required


But unfortunately, this time I didn't find anything from errorlog! then how to capture the detail information? you are right, Profiler trace!

I run the Profiler trace on sql server, and enabled the "Audit login failed" event only. finally I got the detail error message below


by searching the error message, I found the link below

It prove my guess that the window authentication has problem, in other words, the Account should have problem. 

what is the next step?

5. Check if there was any changes made before the error occurred
I am not a AD expert, troubleshooting the window account authentication is little bit hard for me, I can do it, but it might take several hours or days to troubleshooting it. so the easiest way is checking with the guy who report this issue to me, or ask AD expert to look into it. 

I asked the engineer who report this issue : is there any change they made on the account 'xxx\xxxxx-db' before the error occurred? suddenly they seems to remember something, and told me wait a minute, then they come back to me and said the issue has been solved, the mirror is recovered  now. I went back to the server, it is true, all database are in mirror synchronized status.

I asked them what happen, they told they made some changes on that account(like pull the account out of some domain groups), if I didn't mention the account to them, they would never think about the problem was caused by their change. so problem is solved. 

Despite no root cause here, we have some steps to narrow down the problem, and find a fastest way to solve it. 

Sunday, October 20, 2013

is count(1) faster than count(*)?

Recently I saw a post regarding the count(1) and count(*)

the post said "
You know that doing COUNT(*) on a table with a lot of columns and a lot of rows can take a lot of time and memory
"
so use count(1) instead of count(*).  Is count(1) really faster than count(*)? Is it true? let's do testing.

first, let's setup the testing db 

--Create DB
CREATE DATABASE [test]
 CONTAINMENT = NONE
 ON  PRIMARY 
( NAME = N'test', FILENAME = N'C:\Program Files\Microsoft SQL Server\MSSQL11.SQL2012\MSSQL\DATA\test.mdf' , SIZE = 512000KB , FILEGROWTH = 102400KB )
 LOG ON 
( NAME = N'test_log', FILENAME = N'C:\Program Files\Microsoft SQL Server\MSSQL11.SQL2012\MSSQL\DATA\test_log.ldf' , SIZE = 102400KB , FILEGROWTH = 102400KB )
GO
use [test]
go


1. Heap Table

--Create Heap table
CREATE SEQUENCE dbo.mysequence
      START WITH 1
      INCREMENT BY 1
GO
select NEXT VALUE FOR dbo.mysequence AS [ID],
a.name, b.create_date,
c.type_desc into mytable 
from sys.objects a, sys.objects b, sys.objects c
GO
--Save table page status
CREATE TABLE DBCCResult (
PageFID NVARCHAR(200),
PagePID NVARCHAR(200),
IAMFID NVARCHAR(200),
IAMPID NVARCHAR(200),
ObjectID NVARCHAR(200),
IndexID NVARCHAR(200),
PartitionNumber NVARCHAR(200),
PartitionID NVARCHAR(200),
iam_chain_type NVARCHAR(200),
PageType NVARCHAR(200),
IndexLevel NVARCHAR(200),
NextPageFID NVARCHAR(200),
NextPagePID NVARCHAR(200),
PrevPageFID NVARCHAR(200),
PrevPagePID NVARCHAR(200)
)
GO

INSERT INTO DBCCResult EXEC ('DBCC IND(test,mytable,-1) ')
GO
--with DBCC IND, we can know there are total 4747 pages in table mytable

a) test count(*)
--Clean Cache
DBCC FREEPROCCACHE
DBCC DROPCLEANBUFFERS
GO
--test count(*)
SET STATISTICS IO ON
set STATISTICS time on
set STATISTICS profile on
GO
select count(*) from mytable
GO
set STATISTICS profile off
set STATISTICS time off
set STATISTICS io off
GO
--save all buffer pool page
select * into Buffer1
from sys.dm_os_buffer_descriptors where database_id=db_id('test')
GO
--check if all data pages have been read to buffer pool
select count(*)

from Buffer1 b inner join DBCCResult d on b.page_id=d.PagePID 

below is the execution plan and IO statistics


and it shows all 4747 pages have been read to buffer pool

b) test count(1)
--Clean Cache
DBCC FREEPROCCACHE
DBCC DROPCLEANBUFFERS
GO
--test count(1)
SET STATISTICS IO ON
set STATISTICS time on
set STATISTICS profile on
GO
select count(1) from mytable
GO
set STATISTICS profile off
set STATISTICS time off
set STATISTICS io off
GO
--save all buffer pool page
select * into Buffer2
from sys.dm_os_buffer_descriptors where database_id=db_id('test')
GO
--check if all data pages have been read to buffer pool
select count(*)
from Buffer2 b inner join DBCCResult d on b.page_id=d.PagePID

you will see the execution plan is the same as count(*), and so is IO statistics


and you can see 4747 pages read to buffer pool as well.

2. Clustered Index Table

created clustered index on table

ALTER TABLE dbo.mytable ADD CONSTRAINT
PK_mytable PRIMARY KEY CLUSTERED 
(
ID
)  ON [PRIMARY]

GO

and rerun the test upper, I still got the same result against count(1) and count(*), they both use clustered index scan(table scan), and read the same page into buffer pool


3. Heap + Non-Clustered Index

create the heap table with the script of first testing, then create non-clustered index below. 
CREATE NONCLUSTERED INDEX IX_mytable_date ON dbo.mytable
(
create_date
) WITH( STATISTICS_NORECOMPUTE = OFF, IGNORE_DUP_KEY = OFF, ALLOW_ROW_LOCKS = ON, ALLOW_PAGE_LOCKS = ON) ON [PRIMARY]
GO


then rerun the testing with count(1) and count*), still no difference, same execution plan and io statistics. but we see index scan this time, which is expected.


so based on my testing, there is no performance difference between them, if you see any difference between count(1) and count(*), please let me know , I am interesting on researching it :)

Tuesday, October 1, 2013

Enable Instant File Initialization to accelerate database restore

Today my colleague come to me and ask me why her database restore query was hang. She was going to restore a database with 200GB data file and 11GB log file.

She had run the restore command for about 15 minutes, but the restore process is still in 0%, it is not the normal situation she knows. I connected to the server and checked the running query status, the "restore database" command was waiting for the "ASYNC_IO_COMPLETION"


then I checked the disk performance, the database file is still in writing, 110MB/sec


before the database restore start writing data back to the data file, the data file needs to be initialized first. if instant file initialization is enabled, this step will be skipped for data file(only data file), looks like instant file initialization is not enabled on this server.

In order to prove it, I run the script from http://blogs.msdn.com/b/sql_pfe_blog/archive/2009/12/23/how-and-why-to-enable-instant-file-initialization.aspx

DBCC TRACEON(3004,3605,-1)
GO
CREATE DATABASE TestFileZero
GO
EXEC sp_readerrorlog
GO
DROP DATABASE TestFileZero
GO
DBCC TRACEOFF(3004,3605,-1)

in the error log file, I do see the
2013-10-01 18:31:05.56 spid104     Zeroing E:\Program Files\Microsoft SQL Server\MSSQL10_50.MSSQLSERVER\MSSQL\DATA\TestFileZero.mdf from page 0 to 131232 (0x0 to 0x40140000)

so the server is not enabled  instant file initialization. the data file is 200GB, disk write speed is 100-110MB/sec, we get : the file initialization will take about 33 minutes.

I told her just waited for half hour, then you would see the progress. and finally, she told me the restore estimate time started changing after 35 minutes :)

This case proves that enabling Instant File Initialization is really important for sql performance, including database restore.


Tuesday, September 24, 2013

List all mapping users of SQL login account

Find a useful system store procedure to list all mapping user of SQL login account.

sp_msloginmappings @Loginname , @Flags

@loginname: the login account name, If loginname is not specified, results are returned for the login accounts
@Flags: value can be 0 and 1, by default 0. 0 means show mapping user in all databases. 1 indicates how mapping user in current database context.

here is sample:
sp_msloginmappings 'test'
show mapping user account info in all databases for login account 'test'

sp_msloginmappings 'test', 1
show mapping user account info in current databases context for login account 'test'

BTW, SQLPS has same function:
(dir sqlserver:\sql\servername\instancename\logins) | foreach { $_.EnumDatabaseMappings()}

Thursday, September 19, 2013

Get SQL Command Compile time

1. SET STATISTICS TIME ON
It not only tell you the compile time of sql command, but also show you the execution times. when you enable it, all the sql command in the current session will be impacted, so it is a good tool to troubleshooting  only 1 sql command at a time, and it can not get compile time of sql command in other sessions.

USE [AdventureWorks]
GO
set statistics time on
go
exec [uspGetManagerEmployees] 100
go
set statistics time off
go

it will show the compile time as below:

SQL Server parse and compile time: 
   CPU time = 31 ms, elapsed time = 62 ms.

if you run the command again, you will get

SQL Server parse and compile time: 
   CPU time = 0 ms, elapsed time = 0 ms.

that's because execution plan has been in the cache, so no compile needed this time.

2. SQL Profiler (or SQL Trace)
SQL Profiler(Trace) can monitor and get sql command compile time in any client session. it has performance impact, especially using SQL Profiler instead of sp_trace_xxxx.

a) SQL Batch
The Batch compile time =  (SQL:StmtStarting StartTime of the first SQL Statement in the batch) - (SQL:BatchStarting StartTime)

you can enable the sql profiler event as below
 

in the sample below, the sql batch compile time = 49.313 - 48.880 = 433ms


b)Store Procedure
The Store Procedure compile time= (SP:StmtStart StartTime of first SQL Statement in the SP) - (SQL:StmtStarting StartTime of the caller SQL Statement)

select the sqp profiler event as below:


run the sample script below:

USE [AdventureWorks]
GO

DECLARE @return_value int

EXEC @return_value = [dbo].[uspGetEmployeeManagers]
@BusinessEntityID = 100

SELECT 'Return Value' = @return_value

GO

and profiler will capture the event log as below:


so the store procedure compile time = 9.910 - 9.617 = 293 ms

c) Dynamic T-SQL
The compile time of Dynamic Query = ( StartTime of StmtStarting of Dynamic Query ) - (EXEC command StartTime of StmtStarting event in batch or SP)

Here we create a dynamic query within a sql batch, and we select the profile event as below:


run the batch:
Declare @query varchar(max)

set @query='

WITH [EMP_cte]([BusinessEntityID], [OrganizationNode], [FirstName], [LastName], [RecursionLevel]) -- CTE name and columns
AS (
    SELECT e.[BusinessEntityID], e.[OrganizationNode], p.[FirstName], p.[LastName], 0 -- Get the initial list of Employees for Manager n
    FROM [HumanResources].[Employee] e 
INNER JOIN [Person].[Person] p 
ON p.[BusinessEntityID] = e.[BusinessEntityID]
    WHERE e.[BusinessEntityID] = 100
    UNION ALL
    SELECT e.[BusinessEntityID], e.[OrganizationNode], p.[FirstName], p.[LastName], [RecursionLevel] + 1 -- Join recursive member to anchor
    FROM [HumanResources].[Employee] e 
        INNER JOIN [EMP_cte]
        ON e.[OrganizationNode].GetAncestor(1) = [EMP_cte].[OrganizationNode]
INNER JOIN [Person].[Person] p 
ON p.[BusinessEntityID] = e.[BusinessEntityID]
    )

SELECT [EMP_cte].[RecursionLevel], [EMP_cte].[OrganizationNode].ToString() as [OrganizationNode], p.[FirstName] AS ''ManagerFirstName'', p.[LastName] AS ''ManagerLastName'',
    [EMP_cte].[BusinessEntityID], [EMP_cte].[FirstName], [EMP_cte].[LastName] -- Outer select from the CTE
FROM [EMP_cte] 
    INNER JOIN [HumanResources].[Employee] e 
    ON [EMP_cte].[OrganizationNode].GetAncestor(1) = e.[OrganizationNode]
INNER JOIN [Person].[Person] p 
ON p.[BusinessEntityID] = e.[BusinessEntityID]
ORDER BY [RecursionLevel], [EMP_cte].[OrganizationNode].ToString()
OPTION (MAXRECURSION 25) 
'

EXEC (@query)
go


and got the trace log as below


so the dynamic query compile time = 40.677 - 40.350 =  327 ms.

3) DMV
MVP Jonathan has a query on his blog, which can show the compile time of cached execution plan
http://www.sqlskills.com/blogs/jonathan/identifying-high-compile-time-statements-from-the-plan-cache/
but it has limitation as all DMV does, if the plan is not in the cached, you will lose the compile info, and the query is only supported by sql 2008 and higher version.

-- Find high compile resource plans in the plan cache
SET TRANSACTION ISOLATION LEVEL READ UNCOMMITTED;
WITH XMLNAMESPACES 
(DEFAULT 'http://schemas.microsoft.com/sqlserver/2004/07/showplan')
SELECT TOP 10
CompileTime_ms,
CompileCPU_ms,
CompileMemory_KB,
qs.execution_count,
qs.total_elapsed_time/1000 AS duration_ms,
qs.total_worker_time/1000 as cputime_ms,
(qs.total_elapsed_time/qs.execution_count)/1000 AS avg_duration_ms,
(qs.total_worker_time/qs.execution_count)/1000 AS avg_cputime_ms,
qs.max_elapsed_time/1000 AS max_duration_ms,
qs.max_worker_time/1000 AS max_cputime_ms,
SUBSTRING(st.text, (qs.statement_start_offset / 2) + 1,
(CASE qs.statement_end_offset
WHEN -1 THEN DATALENGTH(st.text)
ELSE qs.statement_end_offset
END - qs.statement_start_offset) / 2 + 1) AS StmtText,
query_hash,
query_plan_hash
FROM
(
SELECT 
c.value('xs:hexBinary(substring((@QueryHash)[1],3))', 'varbinary(max)') AS QueryHash,
c.value('xs:hexBinary(substring((@QueryPlanHash)[1],3))', 'varbinary(max)') AS QueryPlanHash,
c.value('(QueryPlan/@CompileTime)[1]', 'int') AS CompileTime_ms,
c.value('(QueryPlan/@CompileCPU)[1]', 'int') AS CompileCPU_ms,
c.value('(QueryPlan/@CompileMemory)[1]', 'int') AS CompileMemory_KB,
qp.query_plan
FROM sys.dm_exec_cached_plans AS cp
CROSS APPLY sys.dm_exec_query_plan(cp.plan_handle) AS qp
CROSS APPLY qp.query_plan.nodes('ShowPlanXML/BatchSequence/Batch/Statements/StmtSimple') AS n(c)
) AS tab
JOIN sys.dm_exec_query_stats AS qs
ON tab.QueryHash = qs.query_hash
CROSS APPLY sys.dm_exec_sql_text(qs.sql_handle) AS st
ORDER BY CompileTime_ms DESC
OPTION(RECOMPILE, MAXDOP 1);

here is the result when I run the query, you can see the same duration 327ms as we got with profiler trace


4. Extended Event
I only test extended event on sql 2012.

a) Use the same way as Profiler trace, you can capture the event as below


b) Capture Query_post_compilation_showplan event
the duration field of Query_post_compilation_showplan show the compile time of the execution plan.
Be careful, it is huge performance impact.

here is an example:


this is a extended event trace for sql dynamic query. you can get the compile by
1. Query_post_compilation_showplan event
the duration is 428 ms (the value of duration is microsecond)

2. the ( StartTime of first StmtStarting of Dynamic Query ) - (EXEC command StartTime) =57.419-56.989=430.

a little difference with value from Query_post_compilation_showplan, but almost the same.

Wednesday, August 7, 2013

SQL Server 2012 Express installation failed issue

I got an strange error when installing SQL Server 2012 Express

Environment:
Window Server 2008 R2 Enterprise + SP1
Microsoft Visual Studio 2012 installed
.Net 4.5 framework Installed

When I double clicked SQLEXPRWT_x64_ENU.exe, it just disappeared immediately, no setup window popped up. then I tried
1. unzip the installation code 
SQLEXPRWT_x64_ENU.exe /x

2. Open cmd.exe with administrator role

3. run setup.exe from command line, then I got error message


ERROR: Runtime error: This method explicitly uses CAS policy, which has been obs
oleted by the .NET Framework. In order to enable CAS policy for compatibility re
asons, please use the NetFx40_LegacySecurityPolicy configuration switch. Please
see http://go.microsoft.com/fwlink/?LinkID=155570 for more information.


looks like the error is caused by higher version of .Net Framework.

4. Uninstalled .Net 4.5 framework

5. rerun setup.exe, this time it worked as expected.

sometimes unzip the installation file and run from command line can get more detail error message, especially when you install hotfix and service patch.

Sunday, August 4, 2013

Alwayson availability groups failover monitoring - Part 1

There are a lot of ways to monitor AG, sql server errorlog, window event log, cluster log......, here I list another way to check and monitor AG state with the log files below:

1. AlwaysOn Health Diagnostics Log
http://msdn.microsoft.com/en-us/library/dn135337.aspx
These files in the SQL Server Log directory have the following format: <HOSTNAME>_<INSTANCENAME>_SQLDIAG_X_XXXXXXXXX.xel.

2. Extended Events session "AlwaysOn_health" log
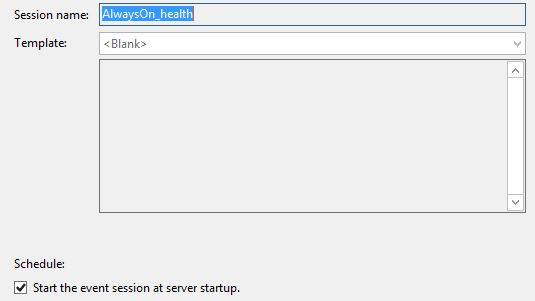
it is auto created when setup alwayson AG,


and by default it does not auto startup, so you can enable it manually


Now, let's use the 2 log files to monitor alwayson AG failover
Enviroment:
>2 nodes  alwayson AG, SQL2012-01(Principle), SQL2012-02(Secondary)
>AG Name: MyAG
>Availability mode: Synchronous commit
>Failover mode:Automatica


1. Manually Failover :   Failover AG from SQL2012-01(01) to SQL2012-02(02)
Please note: Do not use the Failover Cluster Manager to move availability groups to different nodes or to fail over availability groups. The Failover Cluster Manager is not aware of the synchronization status of the availability replicas, and doing so can lead to extended downtime.
ou must use Transact-SQL or SQL Server Management Stud
http://sqlcat.com/sqlcat/b/msdnmirror/archive/2012/03/30/do-not-use-windows-failover-cluster-manager-to-perform-availability-group-failover.aspx

We run the T-sql below on 02
ALTER AVAILABILITY GROUP MyAG failover
go

a) On 01, Open "Merge Extended Event Files"


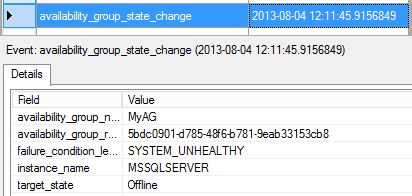
b)Open "AlwaysOn Health Diagnostics Log" file and Extended Events session "AlwaysOn_health" log


c)Sort result by "timestamp"


you can also click "Choose Columns" to add more column to display.

d)Check the log by failover time.
> the first log we find is AVAILABILITY GROUP "offline Pending" State


so AG is taking offline.

>Next, the replica state on 01 is changed from "Primary" to "Resolving"


>Next, AG is offline completely


>finally, replica state is changed from "Resolving" to "Secondary"


e) On 02, use the same way to check the log file
>first, the failover command was issue on 02, begin failover


>Next, replica state is changed from "Secondary" to "Resolving_Pending_Failover"


there are also some "info" message among all events, for instance, it shows the "Diagnostics" is started on new primary 02


>Next, replica state is changed from "Resolving_Pending_Failover" to "Resolving_Normal", then changed to "Primary_Pending"


>Next, AG came online on 02


>Finally, "Alter availability group" command was commit, and replica became to "Primary"


Next, I will try to monitor the AG in other conditions.

Tuesday, July 23, 2013

Gap issue in SQL Server 2012 IDENTITY column

Found a gap issue when using IDENTITY column in SQL Server 2012, every time I restarted sql server service, the current identity number will jump to 1000. here is the repro script

CREATE TABLE MYTEST (ID INT IDENTITY(1,1),
CREATE_DATE datetime);

GO

INSERT INTO MYTEST(CREATE_DATE)
VALUES (GETDATE())
GO 10

DBCC CHECKIDENT ('MYTEST')
GO

the output will be like
Checking identity information: current identity value '10', current column value '10'.
DBCC execution completed. If DBCC printed error messages, contact your system administrator.

then restart sql service, and run

DBCC CHECKIDENT ('MYTEST')
GO

this time we got
Checking identity information: current identity value '1001', current column value '10'.
DBCC execution completed. If DBCC printed error messages, contact your system administrator.


by searching Google, there is a product connection about this issue
https://connect.microsoft.com/SQLServer/feedback/details/739013/alwayson-failover-results-in-reseed-of-identity#details

There are 2 workaround provided.
1. Use trace flag 272


in my testing, the trace flag 272 works good.

2. Use a sequence generator with the NO CACHE setting(http://msdn.microsoft.com/en-us/library/ff878091.aspx).This will cause a log record to be generated for each generated sequence value. Note that the performance of sequence value generation may be impacted by using NO CACHE.

Example:
CREATE SEQUENCE s1 AS INT START WITH 1 NO CACHE;
CREATE TABLE t1 (Id INT PRIMARY KEY DEFAULT NEXT VALUE FOR s1, col INT NOT NULL);

Tuesday, July 9, 2013

Find out orphan database file on disk

Sometimes you detach databases,  or you delete a database which is in restoring status,  the data and log file will not be removed from local disk. if you forget the files,  It might cause issues
1. The files waste disk space
2. If you restore the database back to the original place,  the restore will be failed  because of the existing files.

so here is a powershell script which can find out orphan database files on disk. the script can
1. Get the database default file path from registry
2. Search all mdf, ndf and ldf files
3. Check the sql server system table to see if all files are attached.
4. Print out the file name if the file is not attached to any database.

you can download the script from here
https://docs.google.com/file/d/0B4Xde9z-OME1WWozY0hyWVpnTkU/edit?usp=sharing

and run the script as below:


here, 2 orphan db files(my.mdf and my.ldf) are found in instance sqlexpress.


Tuesday, July 2, 2013

trace flag for backup and restore operation

1. 3004
show the internal backup/restore operation for every step.
ex.
dbcc traceon(3004,3605,-1)
GO

3605 means output the message to errorlog. you can use 3604 to direct the output to client, but it doesn't have the time info which 3605 has. The output looks like below:
LogDate                                 ProcessInfo Text
2013-07-02 16:48:52.280 spid53 RestoreDatabase: Database AdventureWorks
2013-07-02 16:48:52.280 spid53 Opening backup set
2013-07-02 16:48:52.310 spid53 SetTargetRestoreAge: 0
2013-07-02 16:48:52.310 spid53 Restore: Configuration section loaded
2013-07-02 16:48:52.310 spid53 Restore: Backup set is open
2013-07-02 16:48:52.310 spid53 Restore: Planning begins
2013-07-02 16:48:52.320 spid53 Restore: Planning complete
2013-07-02 16:48:52.320 spid53 Restore: BeginRestore (offline) on AdventureWorks
2013-07-02 16:48:52.320 spid53 Restore: Attached database AdventureWorks as DBID=15
2013-07-02 16:48:52.320 spid53 Restore: PreparingContainers
2013-07-02 16:48:52.340 spid53 Zeroing C:\Program Files\Microsoft SQL Server\MSSQL11.SQL2012\MSSQL\DATA\AdventureWorks2012_log.ldf from page 1 to 64000 (0x2000 to 0x1f400000)
2013-07-02 16:48:52.350 spid53 Restore: Containers are ready
2013-07-02 16:48:52.400 spid53 Restore: Restoring backup set
2013-07-02 16:48:52.400 spid53 Restore: Transferring data to AdventureWorks
2013-07-02 16:49:01.640 spid53 Restore: Waiting for log zero on AdventureWorks
2013-07-02 16:49:11.160 spid53 Zeroing completed on C:\Program Files\Microsoft SQL Server\MSSQL11.SQL2012\MSSQL\DATA\AdventureWorks2012_log.ldf
2013-07-02 16:49:11.210 spid53 Restore: LogZero complete
2013-07-02 16:49:11.210 spid53 SetTargetRestoreAge: 0
2013-07-02 16:49:11.320 spid53 FileHandleCache: 0 files opened. CacheSize: 12
2013-07-02 16:49:11.320 spid53 Restore: Data transfer complete on AdventureWorks
2013-07-02 16:49:11.330 spid53 Restore: Backup set restored
2013-07-02 16:49:11.410 spid53 Starting up database 'AdventureWorks'.
2013-07-02 16:49:11.410 spid53 The database 'AdventureWorks' is marked RESTORING and is in a state that does not allow recovery to be run.
2013-07-02 16:49:11.420 spid53 Restore-Redo begins on database AdventureWorks
2013-07-02 16:49:13.390 spid53 RunOfflineRedo logIter.Init(): FirstLsn(PruId: 0): 0x82:0x155:0x45
2013-07-02 16:49:13.390 spid53 RunOfflineRedo logIter.Init(): LastLsn(PruId: 0): 0x82:0x173:0x1
2013-07-02 16:49:13.400 spid53 OfflineRollforward: StopLsn/LastLsn(PruId: 0): 0x82:0x173:0x1
2013-07-02 16:49:13.410 spid53 Rollforward complete on database AdventureWorks
2013-07-02 16:49:13.420 spid53 Restore: Done with fixups
2013-07-02 16:49:13.420 spid53 Restore: Transitioning database to ONLINE
2013-07-02 16:49:13.430 spid53 Restore: Restarting database for ONLINE
2013-07-02 16:49:13.530 spid53 Starting up database 'AdventureWorks'.
2013-07-02 16:49:13.970 spid53 FixupLogTail(progress) zeroing C:\Program Files\Microsoft SQL Server\MSSQL11.SQL2012\MSSQL\DATA\AdventureWorks2012_log.ldf from 0x23ee600 to 0x23f0000.
2013-07-02 16:49:13.970 spid53 Zeroing C:\Program Files\Microsoft SQL Server\MSSQL11.SQL2012\MSSQL\DATA\AdventureWorks2012_log.ldf from page 4600 to 4688 (0x23f0000 to 0x24a0000)
2013-07-02 16:49:13.980 spid53 Zeroing completed on C:\Program Files\Microsoft SQL Server\MSSQL11.SQL2012\MSSQL\DATA\AdventureWorks2012_log.ldf
2013-07-02 16:49:14.080 spid53 PostRestoreContainerFixups: fixups complete
2013-07-02 16:49:14.130 spid53 PostRestoreReplicationFixup for AdventureWorks starts
2013-07-02 16:49:14.810 spid53 PostRestoreReplicationFixup for AdventureWorks complete
2013-07-02 16:49:14.870 spid53 Restore: Database is restarted
2013-07-02 16:49:14.870 Backup Restore is complete on database 'AdventureWorks'.  The database is now available.
2013-07-02 16:49:14.880 spid53 Resuming any halted fulltext crawls
2013-07-02 16:49:15.060 spid53 Restore: Writing history records
2013-07-02 16:49:15.060 Backup Database was restored: Database: AdventureWorks, creation date(time): 2013/07/02(16:33:47), first LSN: 130:341:69, last LSN: 130:371:1, number of dump devices: 1, device information: (FILE=1, TYPE=DISK: {'c:\temp\AdventureWorks.bak'}). Informational message. No user action required.
2013-07-02 16:49:15.060 spid53 Writing backup history records
2013-07-02 16:49:15.080 spid53 Restore: Done with MSDB maintenance
2013-07-02 16:49:15.080 spid53 RestoreDatabase: Finished

The error log shows the it took 9 seconds to restore data and 19 seconds to zero log file. since I have enabled "Instant file initialization", there is zeroing file step for .mdf file. with trace flag 3004 you can see on which step it takes longest time.


2. 3213
show the buffer and maxtransfersize info.
ex.
dbcc traceon(3213,3605,-1)
GO

in errorlog
2013-07-02 17:24:52.070 spid56 Backup/Restore buffer configuration parameters
2013-07-02 17:24:52.070 spid56 Memory limit: 1009MB
2013-07-02 17:24:52.070 spid56 BufferCount:                6
2013-07-02 17:24:52.070 spid56 Sets Of Buffers:            2
2013-07-02 17:24:52.070 spid56 MaxTransferSize:            1024 KB
2013-07-02 17:24:52.070 spid56 Min MaxTransferSize:        64 KB
2013-07-02 17:24:52.070 spid56 Total buffer space:         12 MB
2013-07-02 17:24:52.070 spid56 Tabular data device count:  1
2013-07-02 17:24:52.070 spid56 Fulltext data device count: 0
2013-07-02 17:24:52.070 spid56 Filestream device count:    0
2013-07-02 17:24:52.070 spid56 TXF device count:           0
2013-07-02 17:24:52.070 spid56 Filesystem i/o alignment:   512
2013-07-02 17:24:52.070 spid56 Media Buffer count:            6
2013-07-02 17:24:52.070 spid56 Media Buffer size:          1024KB
2013-07-02 17:24:52.070 spid56 Encode Buffer count:           6
2013-07-02 17:25:00.880 spid56 Starting up database 'sqlnexus'.
2013-07-02 17:25:00.910 spid56 The database 'sqlnexus' is marked RESTORING and is in a state that does not allow recovery to be run.

here we see 6 buffercount, maxtransfersize is 1024.(for buffercount calculation, please refer to http://blogs.msdn.com/b/sqlserverfaq/archive/2010/05/06/incorrect-buffercount-data-transfer-option-can-lead-to-oom-condition.aspx). before you optimize the buffercount and maxtransfersize parameter of backup and restore command, using trace flag 3213 to check the current default value.

3. other trace flag
    a) 3023
        If Trace Flag 3023 is turned on, the CHECKSUM option is automatically enabled for the BACKUP command. You can turn on Trace Flag 3023 to make sure that all backups use the backup CHECKSUM option. If you do this, you do not have to rewrite all the existing backup scripts
       http://support.microsoft.com/kb/2656988

    b) 3226
        No log backup info written into SQL errorlog file

    c) 3001
        No log backup info saved in msdb tables.

    d) 1806
         Turn off "Instant file initialization". maybe only useful when testing.

    e) 3014 and 3216
        log more detail info , ex.
dbcc traceon(3213,3004,3216,3605,-1)
GO