Showing posts with label Performance. Show all posts

Tuesday, October 1, 2013

Enable Instant File Initialization to accelerate database restore

Today my colleague come to me and ask me why her database restore query was hang. She was going to restore a database with 200GB data file and 11GB log file.

She had run the restore command for about 15 minutes, but the restore process is still in 0%, it is not the normal situation she knows. I connected to the server and checked the running query status, the "restore database" command was waiting for the "ASYNC_IO_COMPLETION"


then I checked the disk performance, the database file is still in writing, 110MB/sec


before the database restore start writing data back to the data file, the data file needs to be initialized first. if instant file initialization is enabled, this step will be skipped for data file(only data file), looks like instant file initialization is not enabled on this server.

In order to prove it, I run the script from http://blogs.msdn.com/b/sql_pfe_blog/archive/2009/12/23/how-and-why-to-enable-instant-file-initialization.aspx

DBCC TRACEON(3004,3605,-1)
GO
CREATE DATABASE TestFileZero
GO
EXEC sp_readerrorlog
GO
DROP DATABASE TestFileZero
GO
DBCC TRACEOFF(3004,3605,-1)

in the error log file, I do see the
2013-10-01 18:31:05.56 spid104     Zeroing E:\Program Files\Microsoft SQL Server\MSSQL10_50.MSSQLSERVER\MSSQL\DATA\TestFileZero.mdf from page 0 to 131232 (0x0 to 0x40140000)

so the server is not enabled  instant file initialization. the data file is 200GB, disk write speed is 100-110MB/sec, we get : the file initialization will take about 33 minutes.

I told her just waited for half hour, then you would see the progress. and finally, she told me the restore estimate time started changing after 35 minutes :)

This case proves that enabling Instant File Initialization is really important for sql performance, including database restore.


Thursday, September 19, 2013

Get SQL Command Compile time

1. SET STATISTICS TIME ON
It not only tell you the compile time of sql command, but also show you the execution times. when you enable it, all the sql command in the current session will be impacted, so it is a good tool to troubleshooting  only 1 sql command at a time, and it can not get compile time of sql command in other sessions.

USE [AdventureWorks]
GO
set statistics time on
go
exec [uspGetManagerEmployees] 100
go
set statistics time off
go

it will show the compile time as below:

SQL Server parse and compile time: 
   CPU time = 31 ms, elapsed time = 62 ms.

if you run the command again, you will get

SQL Server parse and compile time: 
   CPU time = 0 ms, elapsed time = 0 ms.

that's because execution plan has been in the cache, so no compile needed this time.

2. SQL Profiler (or SQL Trace)
SQL Profiler(Trace) can monitor and get sql command compile time in any client session. it has performance impact, especially using SQL Profiler instead of sp_trace_xxxx.

a) SQL Batch
The Batch compile time =  (SQL:StmtStarting StartTime of the first SQL Statement in the batch) - (SQL:BatchStarting StartTime)

you can enable the sql profiler event as below
 

in the sample below, the sql batch compile time = 49.313 - 48.880 = 433ms


b)Store Procedure
The Store Procedure compile time= (SP:StmtStart StartTime of first SQL Statement in the SP) - (SQL:StmtStarting StartTime of the caller SQL Statement)

select the sqp profiler event as below:


run the sample script below:

USE [AdventureWorks]
GO

DECLARE @return_value int

EXEC @return_value = [dbo].[uspGetEmployeeManagers]
@BusinessEntityID = 100

SELECT 'Return Value' = @return_value

GO

and profiler will capture the event log as below:


so the store procedure compile time = 9.910 - 9.617 = 293 ms

c) Dynamic T-SQL
The compile time of Dynamic Query = ( StartTime of StmtStarting of Dynamic Query ) - (EXEC command StartTime of StmtStarting event in batch or SP)

Here we create a dynamic query within a sql batch, and we select the profile event as below:


run the batch:
Declare @query varchar(max)

set @query='

WITH [EMP_cte]([BusinessEntityID], [OrganizationNode], [FirstName], [LastName], [RecursionLevel]) -- CTE name and columns
AS (
    SELECT e.[BusinessEntityID], e.[OrganizationNode], p.[FirstName], p.[LastName], 0 -- Get the initial list of Employees for Manager n
    FROM [HumanResources].[Employee] e 
INNER JOIN [Person].[Person] p 
ON p.[BusinessEntityID] = e.[BusinessEntityID]
    WHERE e.[BusinessEntityID] = 100
    UNION ALL
    SELECT e.[BusinessEntityID], e.[OrganizationNode], p.[FirstName], p.[LastName], [RecursionLevel] + 1 -- Join recursive member to anchor
    FROM [HumanResources].[Employee] e 
        INNER JOIN [EMP_cte]
        ON e.[OrganizationNode].GetAncestor(1) = [EMP_cte].[OrganizationNode]
INNER JOIN [Person].[Person] p 
ON p.[BusinessEntityID] = e.[BusinessEntityID]
    )

SELECT [EMP_cte].[RecursionLevel], [EMP_cte].[OrganizationNode].ToString() as [OrganizationNode], p.[FirstName] AS ''ManagerFirstName'', p.[LastName] AS ''ManagerLastName'',
    [EMP_cte].[BusinessEntityID], [EMP_cte].[FirstName], [EMP_cte].[LastName] -- Outer select from the CTE
FROM [EMP_cte] 
    INNER JOIN [HumanResources].[Employee] e 
    ON [EMP_cte].[OrganizationNode].GetAncestor(1) = e.[OrganizationNode]
INNER JOIN [Person].[Person] p 
ON p.[BusinessEntityID] = e.[BusinessEntityID]
ORDER BY [RecursionLevel], [EMP_cte].[OrganizationNode].ToString()
OPTION (MAXRECURSION 25) 
'

EXEC (@query)
go


and got the trace log as below


so the dynamic query compile time = 40.677 - 40.350 =  327 ms.

3) DMV
MVP Jonathan has a query on his blog, which can show the compile time of cached execution plan
http://www.sqlskills.com/blogs/jonathan/identifying-high-compile-time-statements-from-the-plan-cache/
but it has limitation as all DMV does, if the plan is not in the cached, you will lose the compile info, and the query is only supported by sql 2008 and higher version.

-- Find high compile resource plans in the plan cache
SET TRANSACTION ISOLATION LEVEL READ UNCOMMITTED;
WITH XMLNAMESPACES 
(DEFAULT 'http://schemas.microsoft.com/sqlserver/2004/07/showplan')
SELECT TOP 10
CompileTime_ms,
CompileCPU_ms,
CompileMemory_KB,
qs.execution_count,
qs.total_elapsed_time/1000 AS duration_ms,
qs.total_worker_time/1000 as cputime_ms,
(qs.total_elapsed_time/qs.execution_count)/1000 AS avg_duration_ms,
(qs.total_worker_time/qs.execution_count)/1000 AS avg_cputime_ms,
qs.max_elapsed_time/1000 AS max_duration_ms,
qs.max_worker_time/1000 AS max_cputime_ms,
SUBSTRING(st.text, (qs.statement_start_offset / 2) + 1,
(CASE qs.statement_end_offset
WHEN -1 THEN DATALENGTH(st.text)
ELSE qs.statement_end_offset
END - qs.statement_start_offset) / 2 + 1) AS StmtText,
query_hash,
query_plan_hash
FROM
(
SELECT 
c.value('xs:hexBinary(substring((@QueryHash)[1],3))', 'varbinary(max)') AS QueryHash,
c.value('xs:hexBinary(substring((@QueryPlanHash)[1],3))', 'varbinary(max)') AS QueryPlanHash,
c.value('(QueryPlan/@CompileTime)[1]', 'int') AS CompileTime_ms,
c.value('(QueryPlan/@CompileCPU)[1]', 'int') AS CompileCPU_ms,
c.value('(QueryPlan/@CompileMemory)[1]', 'int') AS CompileMemory_KB,
qp.query_plan
FROM sys.dm_exec_cached_plans AS cp
CROSS APPLY sys.dm_exec_query_plan(cp.plan_handle) AS qp
CROSS APPLY qp.query_plan.nodes('ShowPlanXML/BatchSequence/Batch/Statements/StmtSimple') AS n(c)
) AS tab
JOIN sys.dm_exec_query_stats AS qs
ON tab.QueryHash = qs.query_hash
CROSS APPLY sys.dm_exec_sql_text(qs.sql_handle) AS st
ORDER BY CompileTime_ms DESC
OPTION(RECOMPILE, MAXDOP 1);

here is the result when I run the query, you can see the same duration 327ms as we got with profiler trace


4. Extended Event
I only test extended event on sql 2012.

a) Use the same way as Profiler trace, you can capture the event as below


b) Capture Query_post_compilation_showplan event
the duration field of Query_post_compilation_showplan show the compile time of the execution plan.
Be careful, it is huge performance impact.

here is an example:


this is a extended event trace for sql dynamic query. you can get the compile by
1. Query_post_compilation_showplan event
the duration is 428 ms (the value of duration is microsecond)

2. the ( StartTime of first StmtStarting of Dynamic Query ) - (EXEC command StartTime) =57.419-56.989=430.

a little difference with value from Query_post_compilation_showplan, but almost the same.

Wednesday, April 3, 2013

Compression Backup with BUFFERCOUNT parameter

If you want to make you backup faster, you can try BUFFERCOUNT parameter with compression backup.

From Book Online description:

BUFFERCOUNT = { buffercount | @buffercount_variable }
Specifies the total number of I/O buffers to be used for the backup operation. You can specify any positive integer; however, large numbers of buffers might cause "out of memory" errors because of inadequate virtual address space in the Sqlservr.exe process.
The total space used by the buffers is determined by: buffercount * maxtransfersize.

Below is my testing result, all backups use compression parameter. the data file is 195GB with 11GB used. by using compression, the backup file is 8.4GB

1. No BUFFERCOUNT parameter
BACKUP DATABASE abc TO DISK = 'c:\temp\abc.bak' WITH COMPRESSION

it completed with 88MB/sec throughput, avg cpu% is 45

2. Add BUFFERCOUNT parameter
BACKUP DATABASE abc TO DISK = 'c:\temp\abc.bak' WITH COMPRESSION, BUFFERCOUNT = 50
it completed with 105MB/sec throughput, avg cpu% is 50

Next I tried BUFFERCOUNT = 100, BUFFERCOUNT = 150 and BUFFERCOUNT = 200

here is the result:

based on the diagram upper, when BUFFERCOUNT = 100, Throughput reach the ceiling, comparing with the first command without BUFFERCOUNT parameter(default), we made the backup process 30% faster.

you can also use multiple backup files to reach the same goal. 

3. Test multiple backup files
my sql server has 2 CPU, so I use 2 backup files:
BACKUP DATABASE abc TO 
DISK = 'c:\temp\abc1.bak',
DISK = 'c:\temp\abc2.bak'
WITH COMPRESSION

it completed with 115MB/sec throughput. avg cpu 60%.

4. Test multiple backup files with BUFFERCOUNT parameter
BACKUP DATABASE abc TO 
DISK = 'c:\temp\abc1.bak',
DISK = 'c:\temp\abc2.bak'
WITH COMPRESSION, BUFFERCOUNT = 50


based on the diagram upper, there is only 5% performance difference between using BUFFERCOUNT and no BUFFERCOUNT.

Although BUFFERCOUNT makes higher CPU %, the backup always runs during off business, so if you can afford the higher CPU% penalty, it is worth to try BUFFERCOUNT. Please test the appropriate BUFFERCOUNT value based on your environment. 


Reference:
http://sqlcat.com/sqlcat/b/technicalnotes/archive/2008/04/21/tuning-the-performance-of-backup-compression-in-sql-server-2008.aspx


Thursday, February 21, 2013

Get Perfmon data with Powershell

Sometimes you just want to have a look at the system performance, or you feel tired with log on the server, open the perfmon and configure the performance counter, perhaps you want to run a simple command to get the performance data from remote server, here we have a convenient way check the system performance counter on remote server:

Powershell Command : Get-Counter
http://technet.microsoft.com/en-us/library/hh849685.aspx

However, read the data from Get-Counter is not a easy way, so I wrapped it up with several functions and put them into a powershell module : osperfmon.psm1
you can download it from
https://docs.google.com/file/d/0B4Xde9z-OME1ZHhEZG8tS3h4Sms/edit?usp=sharing

Here is the steps to run it
       1.Setup the module.
    • Download the osperfmon.psm1, Copy it to local drive
    • Open powershell window, and import the module
                    Import-Module .\osPerfmon.psm1
              
    • List the available function
                   Get-Command -Module osperfmon
                 

      2. Get Function detail.
       You can get the function help with "Get-Help -detailed", for instance
       Get-Help Get-CPUPerf -Detailed


Here is the sample for each function:
1. Get-CPUPerf


   2. Get-DiskPerf


 3. Get-MemoryPerf


4. Get-NetPerf


5. Get-ProcessPerf

Each function has several parameter, like -SortBy, -Top. you can customize it with your demand.

your suggestion and advice are welcomed. thanks  


Monday, January 28, 2013

"Auto update statistics" option on tempdb

"Auto update statistics" option is enabled by default on tempdb, if it is disabled, you may get trouble in some case.Today when I tested script, I found the index created on the temp table didn't work because of "Auto update statistics" disabled.

here is the script.

USE [master]
GO
ALTER DATABASE [tempdb] SET AUTO_UPDATE_STATISTICS OFF WITH NO_WAIT
GO
USE [tempdb]
GO
dbcc freeproccache
GO
Create table #mytemp1(a int, b int)
GO
create  index temp_inx1 on #mytemp1(a)
GO
declare @int int
set @int=1
while @int <10000
begin
insert into #mytemp1 values(@int, @int+1)
--insert into #mytemp2 values(@int, @int+1)
set @int+=1
end

GO
set statistics profile on
GO
select b from #mytemp1 where a=50
GO
set statistics profile off
GO


and you can see the script use table scan instead of index seek, because we created an index on a, table scan is not we wanted.

let's enable the "Auto update statistics", and do the test again
USE [master]
GO
ALTER DATABASE [tempdb] SET AUTO_UPDATE_STATISTICS on WITH NO_WAIT
GO
USE [tempdb]
GO
dbcc freeproccache
GO
Create table #mytemp1(a int, b int)
GO
create  index temp_inx1 on #mytemp1(a)
GO
declare @int int
set @int=1
while @int <10000
begin
insert into #mytemp1 values(@int, @int+1)
--insert into #mytemp2 values(@int, @int+1)
set @int+=1
end

GO
set statistics profile on
GO
select b from #mytemp1 where a=50
GO
set statistics profile off
GO
drop table #mytemp1

this time we got index seek, this is because:
when "Auto update statistics" is enabled, sql server will check if statistics is stall before generation query plan. since we inserted 1000 rows after index created, the statistics is stall. then sql server will update the statistics, so sql server can get correct statistics and select index seek instead of table scan as query plan.

if you are working with big temp table object, be careful for the "Auto update statistics" on tempdb. 

Monday, October 29, 2012

Monitor Blocking with Extented Events in SQL 2012

1. Set the "blocked process threshold (s)"
sp_configure 'show advanced options', 1 ;
GO
RECONFIGURE ;
GO
sp_configure 'blocked process threshold', 10 ;
GO
RECONFIGURE ;
GO

here we set the threshold to 10 seconds, which generating a blocked process report for each task that is blocked.

2. Create Extented Events Session
CREATE EVENT SESSION [blockingMonitor] ON SERVER
ADD EVENT sqlserver.blocked_process_report(
    ACTION(sqlos.task_time,sqlserver.database_id,sqlserver.database_name,sqlserver.request_id,sqlserver.sql_text))
ADD TARGET package0.event_file(SET filename=N'C:\temp\blockingMonitor.xel')
WITH (MAX_MEMORY=4096 KB,EVENT_RETENTION_MODE=ALLOW_SINGLE_EVENT_LOSS,MAX_DISPATCH_LATENCY=30 SECONDS,MAX_EVENT_SIZE=0 KB,MEMORY_PARTITION_MODE=NONE,TRACK_CAUSALITY=ON,STARTUP_STATE=OFF)
GO

here we save the log to c:\temp\BlockingMonitor.xel file.

3. Start Extented Events Session
ALTER EVENT SESSION [blockingMonitor] ON SERVER STATE=START

4. Create blocking scenario as testing:
    a) create first session, and run
create table test(a int)
go
insert into test values(1)
go
insert into test values(1)
go
insert into test values(1)
go
select @@spid
go
begin tran
update test set a=2
    b) create second session, and run
delete from test

5. Check the blocking log file, and get the blocking info
====================================================================
select 'SPID ' + b.[blocked_process spid]+ ' (from server '+ b.[blocked_process hostname] +' with login account '+ b.[blocked_process loginname]+') wants to acquire '
  + b.[blocked_process lockMode] + ' lock on resource ' + b.[blocked_process waitresource]+', which is owned by SPID '
  + b.[blocking_process spid]+ ' (from server '+ b.[blocking_process hostname] +' with login account '+ b.[blocking_process loginname]+')' as Summary
 ,*
from
(

 select dateadd(HH,DATEDIFF( hh, GETUTCDATE(), GETDATE()),cast(trace.data.value('(/event/@timestamp)[1]', 'DATETIME') as datetime)) as [Time]
   ,trace.data.value ('(/event/data[@name=''database_id'']/value)[1]', 'BIGINT') AS [Databaseid]
   ,trace.data.value ('(/event/data[@name=''lock_mode'']/text)[1]', 'VARCHAR(5)') AS [lock_mode]
   ,trace.data.value ('(/event/data[@name=''transaction_id'']/value)[1]', 'VARCHAR(20)') AS [transaction_id]
   ,trace.data.value ('(/event/data[@name=''blocked_process'']/value/blocked-process-report/blocked-process/process/@id)[1]', 'VARCHAR(20)') AS [blocked_process id]
   ,trace.data.value ('(/event/data[@name=''blocked_process'']/value/blocked-process-report/blocked-process/process/@taskpriority)[1]', 'VARCHAR(20)') AS [blocked_process taskpriority]
   ,trace.data.value ('(/event/data[@name=''blocked_process'']/value/blocked-process-report/blocked-process/process/@logused)[1]', 'VARCHAR(20)') AS [blocked_process logused]
   ,trace.data.value ('(/event/data[@name=''blocked_process'']/value/blocked-process-report/blocked-process/process/@waitresource)[1]', 'VARCHAR(20)') AS [blocked_process waitresource]
   ,trace.data.value ('(/event/data[@name=''blocked_process'']/value/blocked-process-report/blocked-process/process/@waittime)[1]', 'VARCHAR(20)') AS [blocked_process waittime]
   ,trace.data.value ('(/event/data[@name=''blocked_process'']/value/blocked-process-report/blocked-process/process/@ownerId)[1]', 'VARCHAR(20)') AS [blocked_process ownerId]
   ,trace.data.value ('(/event/data[@name=''blocked_process'']/value/blocked-process-report/blocked-process/process/@transactionname)[1]', 'VARCHAR(20)') AS [blocked_process transactionname]
   ,trace.data.value ('(/event/data[@name=''blocked_process'']/value/blocked-process-report/blocked-process/process/@lasttranstarted)[1]', 'VARCHAR(20)') AS [blocked_process lasttranstarted]
   ,trace.data.value ('(/event/data[@name=''blocked_process'']/value/blocked-process-report/blocked-process/process/@XDES)[1]', 'VARCHAR(20)') AS [blocked_process XDES]
   ,trace.data.value ('(/event/data[@name=''blocked_process'']/value/blocked-process-report/blocked-process/process/@lockMode)[1]', 'VARCHAR(20)') AS [blocked_process lockMode]
   ,trace.data.value ('(/event/data[@name=''blocked_process'']/value/blocked-process-report/blocked-process/process/@schedulerid)[1]', 'VARCHAR(20)') AS [blocked_process schedulerid]
   ,trace.data.value ('(/event/data[@name=''blocked_process'']/value/blocked-process-report/blocked-process/process/@kpid)[1]', 'VARCHAR(20)') AS [blocked_process kpid]
   ,trace.data.value ('(/event/data[@name=''blocked_process'']/value/blocked-process-report/blocked-process/process/@status)[1]', 'VARCHAR(20)') AS [blocked_process status]
   ,trace.data.value ('(/event/data[@name=''blocked_process'']/value/blocked-process-report/blocked-process/process/@spid)[1]', 'VARCHAR(20)') AS [blocked_process spid]
   ,trace.data.value ('(/event/data[@name=''blocked_process'']/value/blocked-process-report/blocked-process/process/@sbid)[1]', 'VARCHAR(20)') AS [blocked_process sbid]
   ,trace.data.value ('(/event/data[@name=''blocked_process'']/value/blocked-process-report/blocked-process/process/@ecid)[1]', 'VARCHAR(20)') AS [blocked_process ecid]
   ,trace.data.value ('(/event/data[@name=''blocked_process'']/value/blocked-process-report/blocked-process/process/@priority)[1]', 'VARCHAR(20)') AS [blocked_process priority]
   ,trace.data.value ('(/event/data[@name=''blocked_process'']/value/blocked-process-report/blocked-process/process/@trancount)[1]', 'VARCHAR(20)') AS [blocked_process trancount]
   ,trace.data.value ('(/event/data[@name=''blocked_process'']/value/blocked-process-report/blocked-process/process/@lastbatchstarted)[1]', 'VARCHAR(20)') AS [blocked_process lastbatchstarted]
   ,trace.data.value ('(/event/data[@name=''blocked_process'']/value/blocked-process-report/blocked-process/process/@lastbatchcompleted)[1]', 'VARCHAR(20)') AS [blocked_process lastbatchcompleted]
   ,trace.data.value ('(/event/data[@name=''blocked_process'']/value/blocked-process-report/blocked-process/process/@lastattention)[1]', 'VARCHAR(20)') AS [blocked_process lastattention]
   ,trace.data.value ('(/event/data[@name=''blocked_process'']/value/blocked-process-report/blocked-process/process/@clientapp)[1]', 'VARCHAR(20)') AS [blocked_process clientapp]
   ,trace.data.value ('(/event/data[@name=''blocked_process'']/value/blocked-process-report/blocked-process/process/@hostname)[1]', 'VARCHAR(20)') AS [blocked_process hostname]
   ,trace.data.value ('(/event/data[@name=''blocked_process'']/value/blocked-process-report/blocked-process/process/@hostpid)[1]', 'VARCHAR(20)') AS [blocked_process hostpid]
   ,trace.data.value ('(/event/data[@name=''blocked_process'']/value/blocked-process-report/blocked-process/process/@loginname)[1]', 'VARCHAR(20)') AS [blocked_process loginname]
   ,trace.data.value ('(/event/data[@name=''blocked_process'']/value/blocked-process-report/blocked-process/process/@isolationlevel)[1]', 'VARCHAR(20)') AS [blocked_process isolationlevel]
   ,trace.data.value ('(/event/data[@name=''blocked_process'']/value/blocked-process-report/blocked-process/process/@xactid)[1]', 'VARCHAR(20)') AS [blocked_process xactid]
   ,trace.data.value ('(/event/data[@name=''blocked_process'']/value/blocked-process-report/blocked-process/process/@currentdb)[1]', 'VARCHAR(20)') AS [blocked_process currentdb]
   ,trace.data.value ('(/event/data[@name=''blocked_process'']/value/blocked-process-report/blocked-process/process/@lockTimeout)[1]', 'VARCHAR(20)') AS [blocked_process lockTimeout]
   ,trace.data.value ('(/event/data[@name=''blocked_process'']/value/blocked-process-report/blocked-process/process/@clientoption1)[1]', 'VARCHAR(20)') AS [blocked_process clientoption1]
   ,trace.data.value ('(/event/data[@name=''blocked_process'']/value/blocked-process-report/blocked-process/process/@clientoption2)[1]', 'VARCHAR(20)') AS [blocked_process clientoption2]
   ,trace.data.value ('(/event/data[@name=''blocked_process'']/value/blocked-process-report/blocked-process/process/executionStack/frame/@sqlhandle)[1]', 'VARCHAR(20)') AS [blocked_process sqlhandle]
   ,trace.data.value ('(/event/data[@name=''blocked_process'']/value/blocked-process-report/blocked-process/process/inputbuf)[1]', 'VARCHAR(20)') AS [blocked_process sql]
   ,trace.data.value ('(/event/data[@name=''blocked_process'']/value/blocked-process-report/blocking-process/process/@status)[1]', 'VARCHAR(20)') AS [blocking_process status]
   ,trace.data.value ('(/event/data[@name=''blocked_process'']/value/blocked-process-report/blocking-process/process/@spid)[1]', 'VARCHAR(20)') AS [blocking_process spid]
   ,trace.data.value ('(/event/data[@name=''blocked_process'']/value/blocked-process-report/blocking-process/process/@sbid)[1]', 'VARCHAR(20)') AS [blocking_process sbid]
   ,trace.data.value ('(/event/data[@name=''blocked_process'']/value/blocked-process-report/blocking-process/process/@ecid)[1]', 'VARCHAR(20)') AS [blocking_process ecid]
   ,trace.data.value ('(/event/data[@name=''blocked_process'']/value/blocked-process-report/blocking-process/process/@priority)[1]', 'VARCHAR(20)') AS [blocking_process priority]
   ,trace.data.value ('(/event/data[@name=''blocked_process'']/value/blocked-process-report/blocking-process/process/@trancount)[1]', 'VARCHAR(20)') AS [blocking_process trancount]
   ,trace.data.value ('(/event/data[@name=''blocked_process'']/value/blocked-process-report/blocking-process/process/@lastbatchstarted)[1]', 'VARCHAR(20)') AS [blocking_process lastbatchstarted]
   ,trace.data.value ('(/event/data[@name=''blocked_process'']/value/blocked-process-report/blocking-process/process/@lastbatchcompleted)[1]', 'VARCHAR(20)') AS [blocking_process lastbatchcompleted]
   ,trace.data.value ('(/event/data[@name=''blocked_process'']/value/blocked-process-report/blocking-process/process/@lastattention)[1]', 'VARCHAR(20)') AS [blocking_process lastattention]
   ,trace.data.value ('(/event/data[@name=''blocked_process'']/value/blocked-process-report/blocking-process/process/@clientapp)[1]', 'VARCHAR(20)') AS [blocking_process clientapp]
   ,trace.data.value ('(/event/data[@name=''blocked_process'']/value/blocked-process-report/blocking-process/process/@hostname)[1]', 'VARCHAR(20)') AS [blocking_process hostname]
   ,trace.data.value ('(/event/data[@name=''blocked_process'']/value/blocked-process-report/blocking-process/process/@hostpid)[1]', 'VARCHAR(20)') AS [blocking_process hostpid]
   ,trace.data.value ('(/event/data[@name=''blocked_process'']/value/blocked-process-report/blocking-process/process/@loginname)[1]', 'VARCHAR(20)') AS [blocking_process loginname]
   ,trace.data.value ('(/event/data[@name=''blocked_process'']/value/blocked-process-report/blocking-process/process/@isolationlevel)[1]', 'VARCHAR(20)') AS [blocking_process isolationlevel]
   ,trace.data.value ('(/event/data[@name=''blocked_process'']/value/blocked-process-report/blocking-process/process/@xactid)[1]', 'VARCHAR(20)') AS [blocking_process xactid]
   ,trace.data.value ('(/event/data[@name=''blocked_process'']/value/blocked-process-report/blocking-process/process/@currentdb)[1]', 'VARCHAR(20)') AS [blocking_process currentdb]
   ,trace.data.value ('(/event/data[@name=''blocked_process'']/value/blocked-process-report/blocking-process/process/@lockTimeout)[1]', 'VARCHAR(20)') AS [blocking_process lockTimeout]
   ,trace.data.value ('(/event/data[@name=''blocked_process'']/value/blocked-process-report/blocking-process/process/@clientoption1)[1]', 'VARCHAR(20)') AS [blocking_process clientoption1]
   ,trace.data.value ('(/event/data[@name=''blocked_process'']/value/blocked-process-report/blocking-process/process/@clientoption2)[1]', 'VARCHAR(20)') AS [blocking_process clientoption2]
   ,trace.data.value ('(/event/data[@name=''blocked_process'']/value/blocked-process-report/blocking-process/process/executionStack/frame/@sqlhandle)[1]', 'VARCHAR(20)') AS [blocking_process sqlhandle]
   ,trace.data.value ('(/event/data[@name=''blocked_process'']/value/blocked-process-report/blocking-process/process/inputbuf)[1]', 'VARCHAR(20)') AS [blocking_process sql]
 from(
  select *,CAST(event_data as xml) data
  from sys.fn_xe_file_target_read_file('C:\temp\*.xel', null, null, null)
 ) as trace
) as b

Sunday, August 12, 2012

Monitor Deadlock in SQL 2012

Do you still use trace flag 1204 and 1222 to monitor Deadlock? or using profile to capture deadlock? Now we are in SQL Server 2012!  One of the biggest improvement of SQL 2012 is Extended Events.

Extended Events can replace SQL Profiler, and it is more powerful with less performance impact than SQL Profiler. Extended Events has been introduced in SQL Server world from SQL2008, and in SQL2012, it has been integrated into SQL Server Management Studio(SSMS), see the pic below:

Now you can use SSMS to manage your Extends Events session. By default, there are 2 session created, "AlwaysOn_health" and "system_health", and "system_health" is started when SQL Service startup. You can script the session and check the defination:
CREATE EVENT SESSION [system_health] ON SERVER
ADD EVENT sqlclr.clr_allocation_failure(
    ACTION(package0.callstack,sqlserver.session_id)),
ADD EVENT sqlclr.clr_virtual_alloc_failure(
    ACTION(package0.callstack,sqlserver.session_id)),
ADD EVENT sqlos.memory_broker_ring_buffer_recorded,
ADD EVENT sqlos.memory_node_oom_ring_buffer_recorded(
    ACTION(package0.callstack,sqlserver.session_id,sqlserver.sql_text,sqlserver.tsql_stack)),
ADD EVENT sqlos.scheduler_monitor_deadlock_ring_buffer_recorded,
ADD EVENT sqlos.scheduler_monitor_non_yielding_iocp_ring_buffer_recorded,
ADD EVENT sqlos.scheduler_monitor_non_yielding_ring_buffer_recorded,
ADD EVENT sqlos.scheduler_monitor_non_yielding_rm_ring_buffer_recorded,
ADD EVENT sqlos.scheduler_monitor_stalled_dispatcher_ring_buffer_recorded,
ADD EVENT sqlos.scheduler_monitor_system_health_ring_buffer_recorded,
ADD EVENT sqlos.wait_info(
    ACTION(package0.callstack,sqlserver.session_id,sqlserver.sql_text)
    WHERE ([duration]>(15000) AND ([wait_type]>(31) AND ([wait_type]>(47) AND [wait_type]<(54) OR [wait_type]<(38) OR [wait_type]>(63) AND [wait_type]<(70) OR [wait_type]>(96) AND [wait_type]<(100) OR [wait_type]=(107) OR [wait_type]=(113) OR [wait_type]>(174) AND [wait_type]<(179) OR [wait_type]=(186) OR [wait_type]=(207) OR [wait_type]=(269) OR [wait_type]=(283) OR [wait_type]=(284)) OR [duration]>(30000) AND [wait_type]<(22)))),
ADD EVENT sqlos.wait_info_external(
    ACTION(package0.callstack,sqlserver.session_id,sqlserver.sql_text)
    WHERE ([duration]>(5000) AND ([wait_type]>(365) AND [wait_type]<(372) OR [wait_type]>(372) AND [wait_type]<(377) OR [wait_type]>(377) AND [wait_type]<(383) OR [wait_type]>(420) AND [wait_type]<(424) OR [wait_type]>(426) AND [wait_type]<(432) OR [wait_type]>(432) AND [wait_type]<(435) OR [duration]>(45000) AND ([wait_type]>(382) AND [wait_type]<(386) OR [wait_type]>(423) AND [wait_type]<(427) OR [wait_type]>(434) AND [wait_type]<(437) OR [wait_type]>(442) AND [wait_type]<(451) OR [wait_type]>(451) AND [wait_type]<(473) OR [wait_type]>(484) AND [wait_type]<(499) OR [wait_type]=(365) OR [wait_type]=(372) OR [wait_type]=(377) OR [wait_type]=(387) OR [wait_type]=(432) OR [wait_type]=(502))))),
ADD EVENT sqlserver.connectivity_ring_buffer_recorded(SET collect_call_stack=(1)),
ADD EVENT sqlserver.error_reported(
    ACTION(package0.callstack,sqlserver.database_id,sqlserver.session_id,sqlserver.sql_text,sqlserver.tsql_stack)
    WHERE ([severity]>=(20) OR ([error_number]=(17803) OR [error_number]=(701) OR [error_number]=(802) OR [error_number]=(8645) OR [error_number]=(8651) OR [error_number]=(8657) OR [error_number]=(8902)))),
ADD EVENT sqlserver.security_error_ring_buffer_recorded(SET collect_call_stack=(1)),
ADD EVENT sqlserver.sp_server_diagnostics_component_result(SET collect_data=(1)
    WHERE ([sqlserver].[is_system]=(1) AND [component]<>(4))),
ADD EVENT sqlserver.xml_deadlock_report
ADD TARGET package0.event_file(SET filename=N'system_health.xel',max_file_size=(5),max_rollover_files=(4)),
ADD TARGET package0.ring_buffer(SET max_events_limit=(5000),max_memory=(4096))
WITH (MAX_MEMORY=4096 KB,EVENT_RETENTION_MODE=ALLOW_SINGLE_EVENT_LOSS,MAX_DISPATCH_LATENCY=120 SECONDS,MAX_EVENT_SIZE=0 KB,MEMORY_PARTITION_MODE=NONE,TRACK_CAUSALITY=OFF,STARTUP_STATE=OFF)
GO

So "system_health" will monitor the deadlock event by default. let's try the script below to generate deadlock scenario
====================================================
--create table
create table a1(a int)
create table b1(b int)
insert into a1 values(1)
insert into b1 values(1)

--run in first session
select @@SPID
begin tran
update  a1 set a=2
update  b1 set b=2
--run in second session
select @@SPID
begin tran
update  b1 set b=2
update  a1 set a=2
====================================================

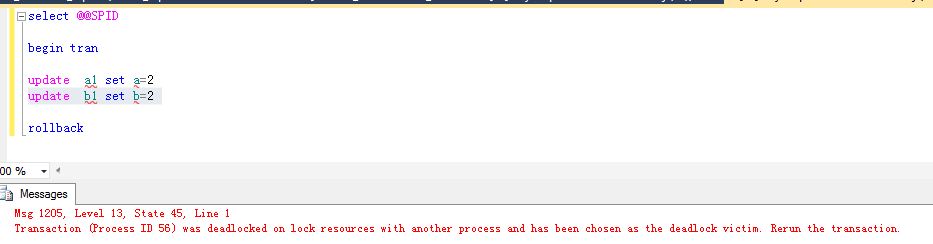
Congrat, you got deadlock and saw the error below


Go back to SSMS,


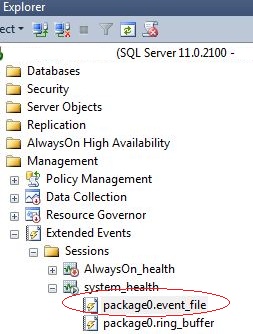
 double click the "package0.event_file" under "system_health", you can review all the event just like below:


Double Click "Value" to check the deadlock detail, here you can find the process and resource info for the deadlock
==============================================
<deadlock>
 <victim-list>
  <victimProcess id="process2ed016558" />
 </victim-list>
 <process-list>
  <process id="process2ed016558" taskpriority="0" logused="248" waitresource="RID: 6:1:169:0" waittime="3029" ownerId="54473" transactionname="user_transaction" lasttranstarted="2012-08-12T18:59:15.827" XDES="0x2f8252d28" lockMode="U" schedulerid="3" kpid="4852" status="suspended" spid="56" sbid="0" ecid="0" priority="0" trancount="2" lastbatchstarted="2012-08-12T18:59:23.397" lastbatchcompleted="2012-08-12T18:59:15.830" lastattention="1900-01-01T00:00:00.830" clientapp="Microsoft SQL Server Management Studio - Query" hostname="V-XUJ1230" hostpid="5688" loginname="FAREAST\v-xuj" isolationlevel="read committed (2)" xactid="54473" currentdb="6" lockTimeout="4294967295" clientoption1="671090784" clientoption2="390200">
   <executionStack>
    <frame procname="adhoc" line="1" stmtstart="16" sqlhandle="0x020000006377082c50d69d2e5f1de789330d2a1e2eda81960000000000000000000000000000000000000000">
UPDATE [b1] set [b] = @1    </frame>
    <frame procname="adhoc" line="1" sqlhandle="0x0200000055304113cb84f9da843e5bdb59f3c2ace4f8aadd0000000000000000000000000000000000000000">
update  b1 set b=2    </frame>
   </executionStack>
   <inputbuf>
update  b1 set b=2
   </inputbuf>
  </process>
  <process id="process2ed0170c8" taskpriority="0" logused="248" waitresource="RID: 6:1:166:0" waittime="6233" ownerId="54474" transactionname="user_transaction" lasttranstarted="2012-08-12T18:59:18.503" XDES="0x2f82523a8" lockMode="U" schedulerid="3" kpid="1456" status="suspended" spid="52" sbid="0" ecid="0" priority="0" trancount="2" lastbatchstarted="2012-08-12T18:59:20.210" lastbatchcompleted="2012-08-12T18:59:18.503" lastattention="1900-01-01T00:00:00.503" clientapp="Microsoft SQL Server Management Studio - Query" hostname="V-XUJ1230" hostpid="5688" loginname="FAREAST\v-xuj" isolationlevel="read committed (2)" xactid="54474" currentdb="6" lockTimeout="4294967295" clientoption1="671090784" clientoption2="390200">
   <executionStack>
    <frame procname="adhoc" line="1" stmtstart="16" sqlhandle="0x020000005cdb030dd161d461be83dc620591979030bbf17f0000000000000000000000000000000000000000">
UPDATE [a1] set [a] = @1    </frame>
    <frame procname="adhoc" line="1" sqlhandle="0x020000008278b7001a4bf6c0edd6eb92e71651f531b4b9da0000000000000000000000000000000000000000">
update  a1 set a=2    </frame>
   </executionStack>
   <inputbuf>
update  a1 set a=2
   </inputbuf>
  </process>
 </process-list>
 <resource-list>
  <ridlock fileid="1" pageid="169" dbid="6" objectname="CDBTEST.dbo.b1" id="lock2f4b46480" mode="X" associatedObjectId="72057594039107584">
   <owner-list>
    <owner id="process2ed0170c8" mode="X" />
   </owner-list>
   <waiter-list>
    <waiter id="process2ed016558" mode="U" requestType="wait" />
   </waiter-list>
  </ridlock>
  <ridlock fileid="1" pageid="166" dbid="6" objectname="CDBTEST.dbo.a1" id="lock2f4b49180" mode="X" associatedObjectId="72057594039042048">
   <owner-list>
    <owner id="process2ed016558" mode="X" />
   </owner-list>
   <waiter-list>
    <waiter id="process2ed0170c8" mode="U" requestType="wait" />
   </waiter-list>
  </ridlock>
 </resource-list>
</deadlock>
==============================================
or you can click the "Deadlock" TAB to see the diagram.

Saturday, June 23, 2012

Rebuild index with "Alter Index Rebuild" or "DBCC DBREINDEX"

You can rebuild all index for a table with "Alter Index Rebuild" and "DBCC DBREINDEX" .

First, in BOL, for "DBCC DBREINDEX" , it mentions
This feature will be removed in the next version of Microsoft SQL Server. Avoid using this feature in new development work, and plan to modify applications that currently use this feature. Use ALTER INDEX instead.

Looks like we'd better replace all "DBCC DBREINDEX" script to "Alter Index Rebuild", however there is a little bit difference between their behavior, let's look a sample:


1. Turn on the "auto  create statistics" option for the testing db
ALTER DATABASE [test] SET AUTO_CREATE_STATISTICS ON WITH NO_WAIT
GO

2. Create sample table
create table abc(t1 int, t2 int)
go
declare @i int
set @i = 0
while @i < 20000
begin
     insert into abc(t1, t2) values (@i, @i)
     set @i = @i + 1 
end
create index abcindx on abc(t1)
go


3. Run the select command below, it will create a statistics automatically on column t2
select count(*) from abc where t2> 500 and t2<600

so we will get 2 statistics on the abc table
  • abcindx is created by index abcindx
  • _WA_Sys_00000002_025D5595 is created by SQL Server automatically to optimize the query performance


4. Check the statistics status
dbcc show_statistics ( abc, _WA_Sys_00000002_025D5595)
go
dbcc show_statistics ( abc, abcindx)
go


 5. Update the table
update abc set t1=12000 where t1>12000
update abc set t2=12006 where t2>11000
go
6.  Rebuild index with DBCC DBREINDEX
DBCC DBREINDEX (abc)

7.  Check the Statistics again, both 2 statistics are updated
 8. Drop the table abc, and redo the step 1 to 5

9. Rebuild index with "ALTER INDEX ALL REBUILD"
ALTER INDEX ALL ON dbo.abc rebuild

10. Check the Statistics again, only statistics abcindx is updated, the auto statistics is not updated yet.

 11. In order to update the auto statistics, you need to run
UPDATE STATISTICS abc
12. Drop the table, and redo step 1 and 2

13. Manually create statistics abcstc on column t2
CREATE STATISTICS abcstc on abc(t2)

14. Redo Step 5, update the table

16. Rebuild index with "ALTER INDEX ALL REBUILD"
ALTER INDEX ALL ON dbo.abc rebuild

17. Check the statistics, you will find the statistics abcstc still hasn't been updated.

So DBCC DBREINDEX not only update the indexes, but also update the statistics(manual or auto created), however, ALTER INDEX  only update the statistics which created by index. if you run ALTER INDEX, you'd better run UPDATE STATISTICS as well.

Tuesday, May 15, 2012

Ad hoc query optimization in SQL Server

When ad hoc queries are executed in sql server, if it is executed without parameters, and it is simple,  SQL Server parameterizes the query internally to increase the possibility of matching it against an existing execution plan, that's called "Simple Parameterization"

For instance:

--clear plan cache first
DBCC FREEPROCCACHE

--run first ad hoc query
select * from dbo.Sales where SalesID= 567

--check query plan

WITH XMLNAMESPACES
(DEFAULT 'http://schemas.microsoft.com/sqlserver/2004/07/showplan')
SELECT
COALESCE(DB_NAME(p.dbid), p.query_plan.value('(//RelOp/OutputList/
ColumnReference/@Database)[1]',
'nvarchar(128)')) AS DatabaseName
,DB_NAME(p.dbid) + '.' + OBJECT_SCHEMA_NAME(p.objectid, p.dbid) + '.' +
OBJECT_NAME(p.objectid, p.dbid) AS ObjectName
,cp.objtype
,cp.cacheobjtype
,p.query_plan
,cp.UseCounts
,cp.plan_handle
,cp.size_in_bytes
,CAST('<?query --' + CHAR(13) + q.text + CHAR(13) + '--?>' AS xml)
AS SQLText
FROM sys.dm_exec_cached_plans cp
CROSS APPLY sys.dm_exec_query_plan(cp.plan_handle) p
CROSS APPLY sys.dm_exec_sql_text(cp.plan_handle) as q
ORDER BY DatabaseName, UseCounts DESC


you can find 2 rows below, one is the ad "hoc query" object, the other is the "
Prepared statement"

the "Prepared statement" is created by sql server Simple Parameterization. then if run a new ad hoc statment below

--run second ad hoc query
select * from dbo.Sales where SalesID= 123

This time there are 2 "ad hoc" objects, but only 1 "Prepared statement" object whose "UseCounts" is 2 now. Because of this simple parameterization, SQL Server recognizes that the following two statements generate essentially the same execution plan and reuses the first plan for the second statement.

Under the default behavior of simple parameterization, SQL Server parameterizes a relatively small class of queries. However, you can specify that all queries in a database be parameterized, subject to certain limitations, by setting the PARAMETERIZATION option of the ALTER DATABASE command to FORCED

ALTER DATABASE [dbname] set PARAMETERIZATION  FORCED

Forced Parameterization is not appropriate in all enviroments and scenarios. It is recommanded that you use it only for a very high volumne of concurrent queries, and when you are seeing hight CPU from a lot of compilation/recompilation.you can monitor the perfmon sql statistics below
• SQL Server: SQL Statistics: Batch Requests/sec
• SQL Server: SQL Statistics: SQL Compilations/sec
• SQL Server: SQL Statistics: SQL Recompilations/sec
Ideally, the ratio of SQL Recompilations/sec to Batch Requests/sec should be very low.

let's try another ad hoc statment below

--clear plan cache first
DBCC FREEPROCCACHE

--run third ad hoc query
select * from dbo.Sales where SalesID= 4444 or CustomerID=903 and CustomerID=17541

As this ad hoc statment is complicated, so simple parameterization doesn't work this time, there is only a "ad hoc" object, No "Prepared statement" object. Then we enable the "Forced Parameterization", and redo the test

 ALTER DATABASE [dbname] set PARAMETERIZATION FORCED
--clear plan cache first
DBCC FREEPROCCACHE

--run fourth ad hoc query
select * from dbo.Sales where SalesID= 4444 or CustomerID=903 and CustomerID=17541

 you can find the "Prepared statement" object created. if you run similiar statment below, the execution plan can be reused.

select * from dbo.Sales where SalesID= 333 or CustomerID=123 and CustomerID=345

Although we can eliminate the execution plan Recompilations of the ad hoc query by enable "Forced Parameterization", every time you run the ad hoc query, there is a new "ad hoc"object created, and it eat up your memory.   there is a system parameter "optimize for ad hoc workloads" which can save the memory usage of ad hoc statement. let run the testing below:

--enable the parameter
sp_configure 'show advanced options', 1;
GO
RECONFIGURE;
GO
sp_configure 'optimize for ad hoc workloads', 1
GO
RECONFIGURe with override
GO

--clear plan cache first
DBCC FREEPROCCACHE

--run fifth ad hoc query
select * from dbo.Sales where SalesID= 567

then check the plan cache, there is only "Compiled Plan Stub" object instead of "Compiled Plan".
So when this option is set to 1, the Database Engine stores a small compiled plan stub in the plan cache when a batch is compiled for the first time, instead of the full compiled plan. This helps to relieve memory pressure by not allowing the plan cache to become filled with compiled plans that are not reused.

let's run the same query again
--run sixth ad hoc query
select * from dbo.Sales where SalesID= 567

this time the "Compiled Plan Stub" become to "Compiled Plan". So when the batch is invoked (compiled or executed) again, the Database Engine compiles the batch, removes the compiled plan stub from the plan cache, and adds the full compiled plan to the plan cache.

Brett Hawton has a query which can help you determin if you need to use 'optimize for ad hoc workloads'
-- Do not run this TSQL until SQL Server has been running for at least 3 hours
SET NOCOUNT ON
SELECT objtype AS [Cache Store Type],
        COUNT_BIG(*) AS [Total Num Of Plans],
        SUM(CAST(size_in_bytes as decimal(14,2))) / 1048576 AS [Total Size In MB],
        AVG(usecounts) AS [All Plans - Ave Use Count],
        SUM(CAST((CASE WHEN usecounts = 1 THEN size_in_bytes ELSE 0 END) as decimal(14,2)))/ 1048576 AS [Size in MB of plans with a Use count = 1],
        SUM(CASE WHEN usecounts = 1 THEN 1 ELSE 0 END) AS [Number of of plans with a Use count = 1]
        FROM sys.dm_exec_cached_plans
        GROUP BY objtype
        ORDER BY [Size in MB of plans with a Use count = 1] DESC
DECLARE @AdHocSizeInMB decimal (14,2), @TotalSizeInMB decimal (14,2)
SELECT @AdHocSizeInMB = SUM(CAST((CASE WHEN usecounts = 1 AND LOWER(objtype) = 'adhoc' THEN size_in_bytes ELSE 0 END) as decimal(14,2))) / 1048576,
        @TotalSizeInMB = SUM (CAST (size_in_bytes as decimal (14,2))) / 1048576
        FROM sys.dm_exec_cached_plans
SELECT @AdHocSizeInMB as [Current memory occupied by adhoc plans only used once (MB)],
         @TotalSizeInMB as [Total cache plan size (MB)],
         CAST((@AdHocSizeInMB / @TotalSizeInMB) * 100 as decimal(14,2)) as [% of total cache plan occupied by adhoc plans only used once]
IF  @AdHocSizeInMB > 200 or ((@AdHocSizeInMB / @TotalSizeInMB) * 100) > 25  -- 200MB or > 25%
        SELECT 'Switch on Optimize for ad hoc workloads as it will make a significant difference' as [Recommendation]
ELSE
        SELECT 'Setting Optimize for ad hoc workloads will make little difference' as [Recommendation]
GO